How to Read an ES Futures Chart Like a Pro
Reading an ES futures chart is an essential skill for anyone trading the E-mini S&P 500. Whether you’re a beginner or looking to refine your technical analysis, understanding chart structure, timeframes, and indicators is key to making smart trading decisions.
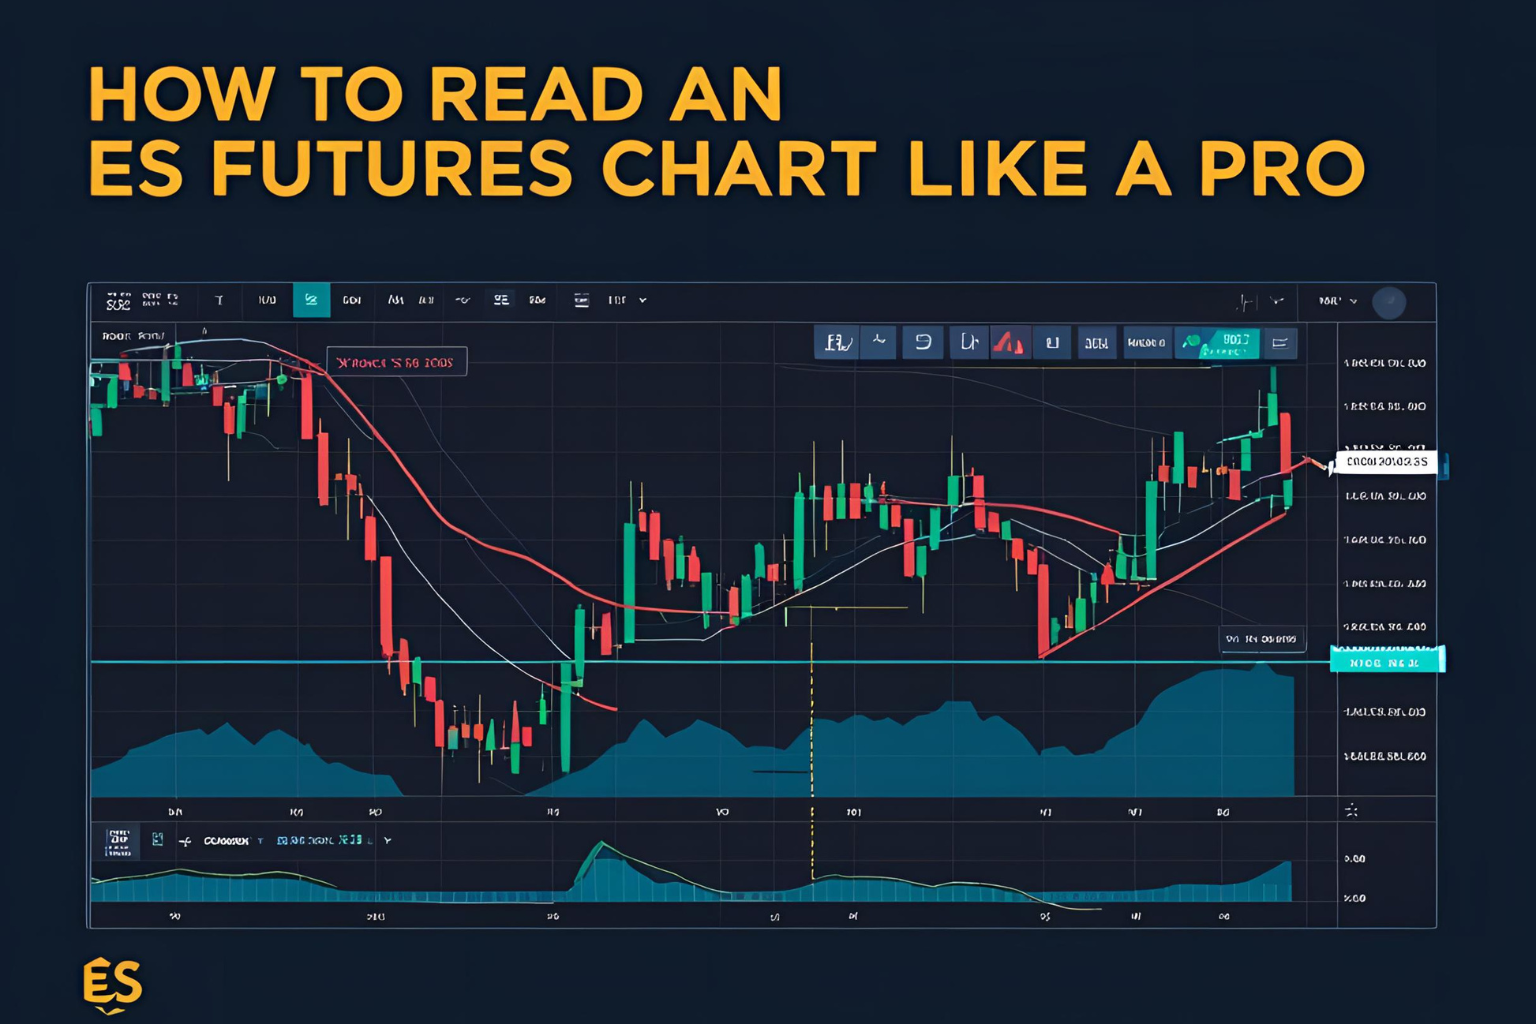
What Is an ES Futures Chart?
An ES futures chart displays the price movement of the ES (E-mini S&P 500 futures) contract over time. It helps traders visualize trends, identify patterns, and make informed entry or exit decisions.
You’ll typically find ES charts on platforms like TradingView, NinjaTrader, Thinkorswim, and MetaTrader 5.
Step 1: Choose the Right Chart Type
Common chart types used for ES futures:
- Candlestick Chart: Most popular; shows open, high, low, and close
- Line Chart: Simple and clean; good for tracking closing prices
- Bar Chart (OHLC): Similar to candlesticks, with a different visual style
- Renko or Heikin Ashi: Filters noise and highlights trends better
✅ Pro Tip: Use candlestick charts for real-time price action and pattern recognition.
Step 2: Select an Appropriate Timeframe
Different trading styles require different timeframes:
- 1-minute to 5-minute: Scalping and intraday trades
- 15-minute to 1-hour: Short-term swing trades
- 4-hour to Daily: Longer-term trend analysis
Use multiple timeframes for deeper confirmation.
Step 3: Add Key Indicators for ES Futures
Start with these basic technical indicators:
- Moving Averages (MA): Identify trend direction and smoothing
- Volume: Shows how strong or weak a price move is
- RSI (Relative Strength Index): Helps identify overbought/oversold conditions
- ATR (Average True Range): Measures volatility
- VWAP (Volume-Weighted Average Price): Crucial for intraday trading
Avoid adding too many indicators—clarity is more important than complexity.
Step 4: Watch for Price Patterns and Key Levels
Common patterns on ES charts:
- Support & Resistance Zones
- Trendlines and Channels
- Double Tops & Bottoms
- Flags, Pennants, and Triangles
Always pair patterns with volume confirmation to improve accuracy.
Step 5: Understand Market Sessions
- Globex session (overnight)
- Regular trading hours (9:30 AM to 4:00 PM ET)
- Pre-market and post-market action influences chart behavior
ES charts move nearly 24/5, so be aware of session-based volatility.
Chart Example: Candlestick Analysis
Let’s say you’re on a 15-minute ES chart:
- A strong bullish engulfing candle on rising volume from support
- Confirmed by RSI moving above 50 and price crossing above VWAP
- You may consider a long entry, with stop below support and target at next resistance
FAQs
Q1. What is the best timeframe for trading ES futures?
It depends on your strategy. Scalpers prefer 1–5 min; swing traders use 15 min to 4-hour charts.
Q2. How do I know when ES futures are trending?
Use moving averages (e.g., 50 EMA) and watch for higher highs and higher lows.
Q3. Should I trade ES using only chart patterns?
Charts are powerful but best used with indicators and volume for confirmation.
Q4. Can I read ES charts on mobile apps?
Yes. Apps like TradingView and TD Ameritrade Mobile offer mobile charting tools.
Q5. Do ES futures charts work the same as stock charts?
Yes, technically. But ES has higher leverage and trades nearly 24 hours a day, which affects analysis.


