How to Trade ES Futures Using Support and Resistance
Support and resistance are two of the most fundamental concepts in technical analysis. When applied correctly, they can offer high-probability entry and exit points for ES futures traders. This guide shows how to trade ES futures using support and resistance in a structured, low-risk way.
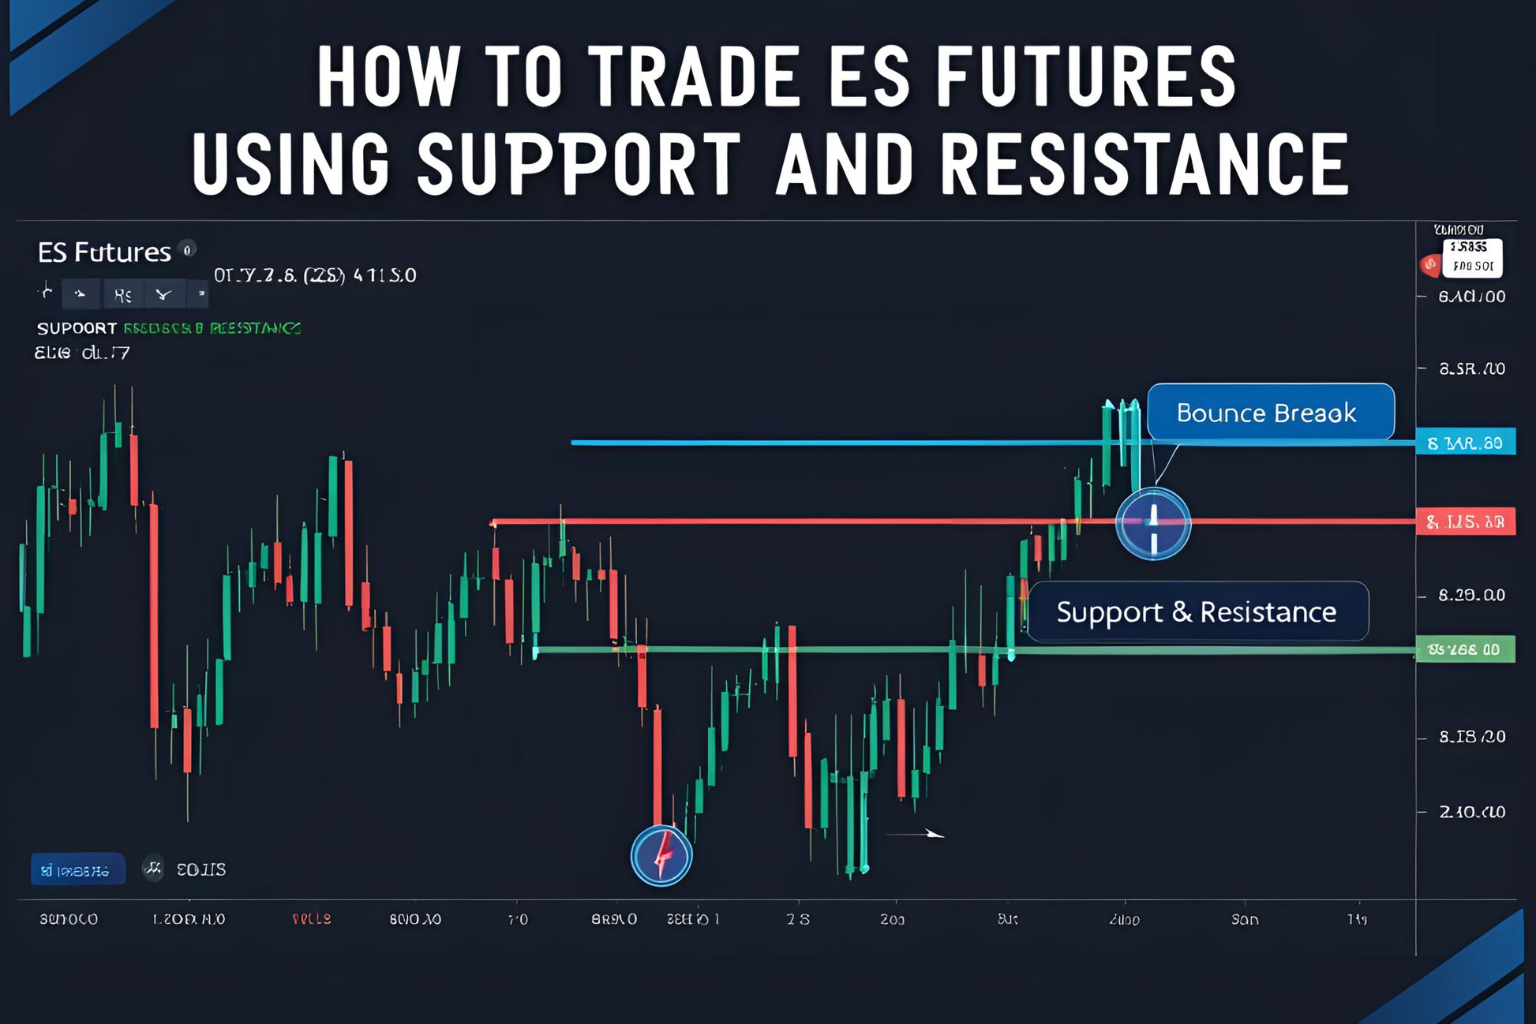
What Are Support and Resistance Levels?
- Support: A price level where buying pressure tends to overcome selling, causing the price to bounce upward.
- Resistance: A level where selling pressure typically halts upward movement, causing price to reverse or consolidate.
These levels act as psychological zones where traders anticipate price reactions.
How to Identify Support and Resistance Zones
- Use Historical Price Action
- Look at previous highs/lows
- Use horizontal lines at multiple touchpoints
- Apply Moving Averages
- The 50 EMA and 200 EMA often act as dynamic support/resistance
- Volume Profile
- High-volume areas (volume nodes) can indicate strong levels
- Pivot Points
- Daily or weekly pivot levels provide reliable reaction points
✅ Tip: Use higher timeframes (1-hour, 4-hour, daily) to find stronger support/resistance.
Trading Strategies Using Support and Resistance
1. Bounce Strategy
- Wait for ES price to touch support or resistance
- Confirm with candlestick pattern (e.g., bullish engulfing at support)
- Enter trade in direction of bounce
- Set stop-loss just beyond the level
- Target the next zone
Works best in range-bound or sideways markets
2. Breakout Strategy
- Price breaks above resistance or below support with strong volume
- Confirm with RSI or MACD crossover
- Enter on the retest of the broken level (now support/resistance flips)
- Stop-loss below breakout candle
- Use ATR to measure realistic target
Best used in trending markets
3. False Break (Fakeout) Strategy
- Price briefly breaks support/resistance but quickly reverses
- Entry after the reversal candle forms (e.g., pin bar or doji)
- Stop-loss beyond the wick
- Target midpoint of recent range
Ideal during low volume sessions or before news events
Chart Example Setup
- Timeframe: 15-minute chart
- Indicators: 50 EMA, VWAP, RSI
- Scenario: ES bounces off support (4,800) with bullish engulfing candle + RSI > 50
- Trade: Long entry at 4,805, stop at 4,795, target 4,820
Risk Management Tips
- Use tight stops near S/R zones to limit loss
- Avoid trading major zones during news events
- Adjust position size based on distance to stop-loss
- Always wait for confirmation—don’t trade blind bounces
FAQs
Q1. Do support and resistance levels work in futures markets?
Yes. These zones are widely respected in ES futures due to the contract’s high liquidity.
Q2. How many times should a level be tested before trading it?
Ideally 2–3 times. The more touches, the stronger the level—but also more likely to break.
Q3. What timeframe is best for support/resistance trading in ES?
Use a combination: 4-hour/daily for identifying levels, and 5-min/15-min for entries.
Q4. Can support become resistance and vice versa?
Yes, this is called a support/resistance flip and often provides strong trade setups.
Q5. Do indicators like RSI help with S/R trading?
Yes. RSI helps confirm momentum around those zones, improving entry timing.


